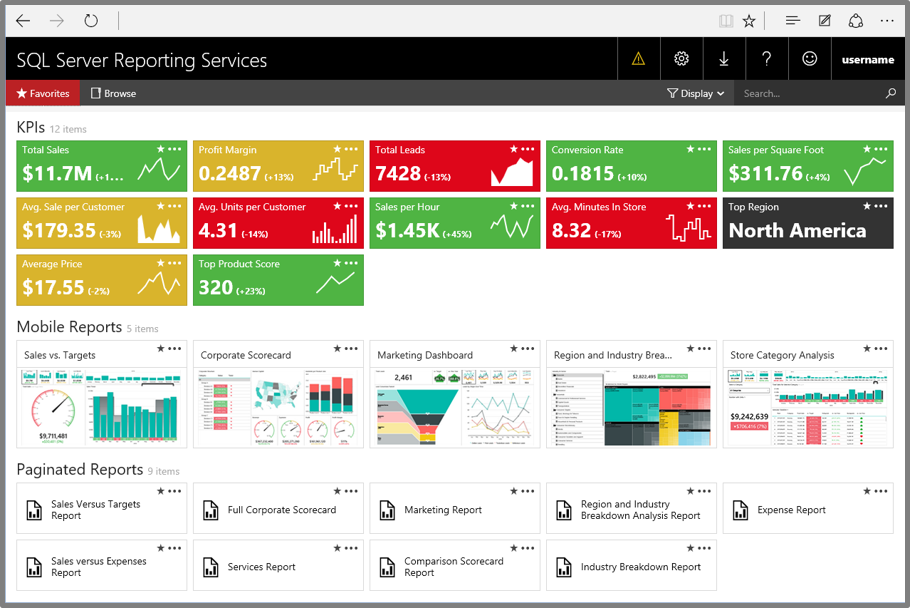
Enterprise Report Examples
Each user is likely to have favorite reports to make timely and effective business decisions, and although it is not possible to cover a whole gamut of reports in this book, some common ideas can help you think through practical applications of SSRS.
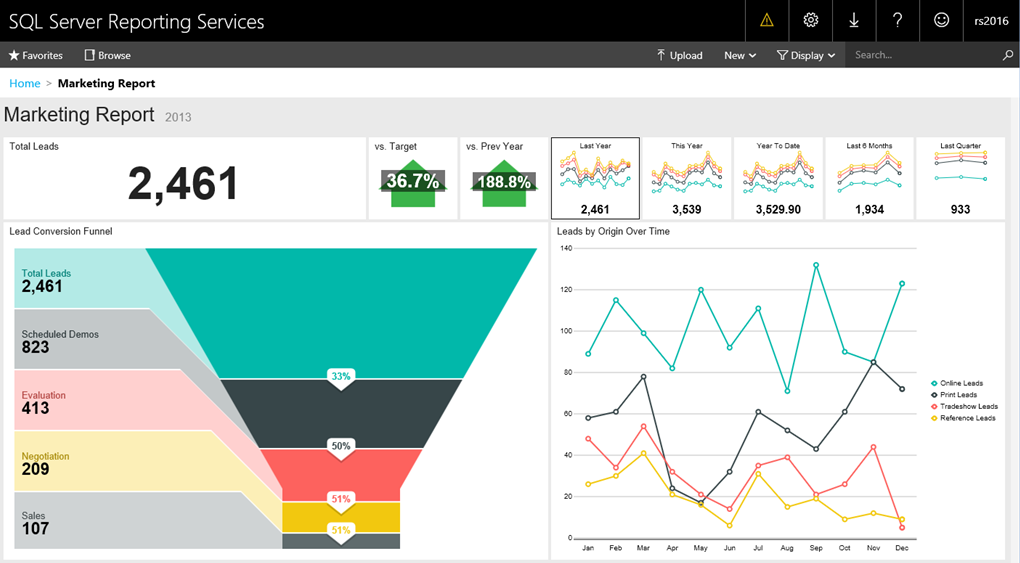
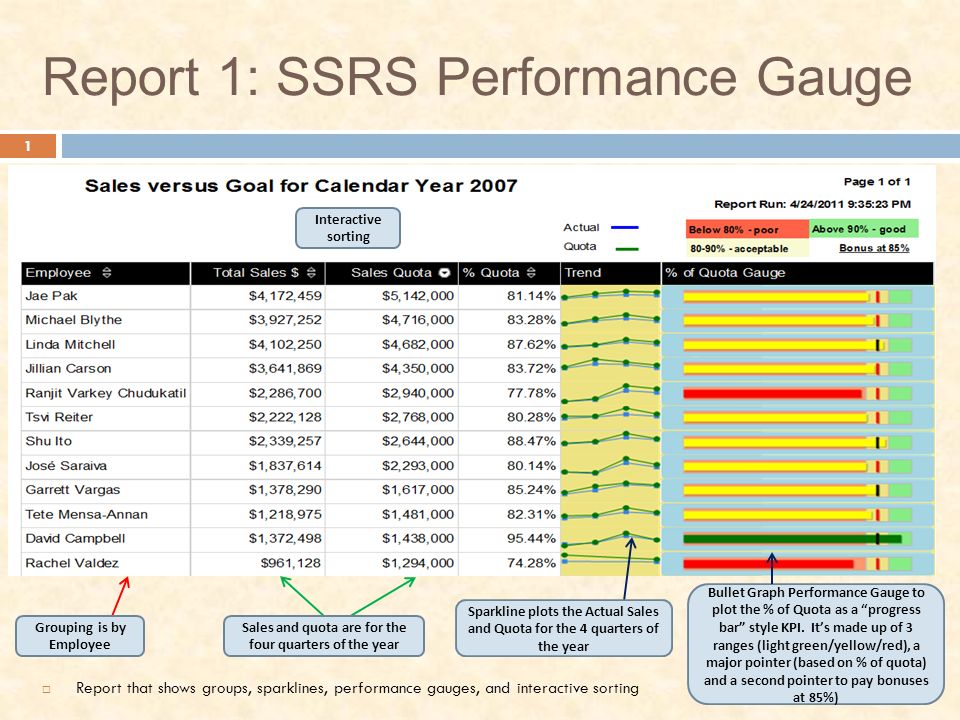
Scorecard reports are frequently used in today’s businesses and provide information for each manager on how well his group is doing as compared to the goals set for the group. Usually, a scorecard implements a “traffic light” type of highlight or a “gauge” indicator. Values on the scorecard are highlighted in green when the group is meeting its goals, in yellow when the group is doing so-so, and in red when the group’s performance requires immediate attention. Scorecard reports can take advantage of the key performance indicators (KPIs) features of Analysis Services 2008. Gauges and charts have been significantly enhanced in SQL Reporting Services 2008 by the acquisition of the Dundas Gauge and Chart controls by Microsoft.
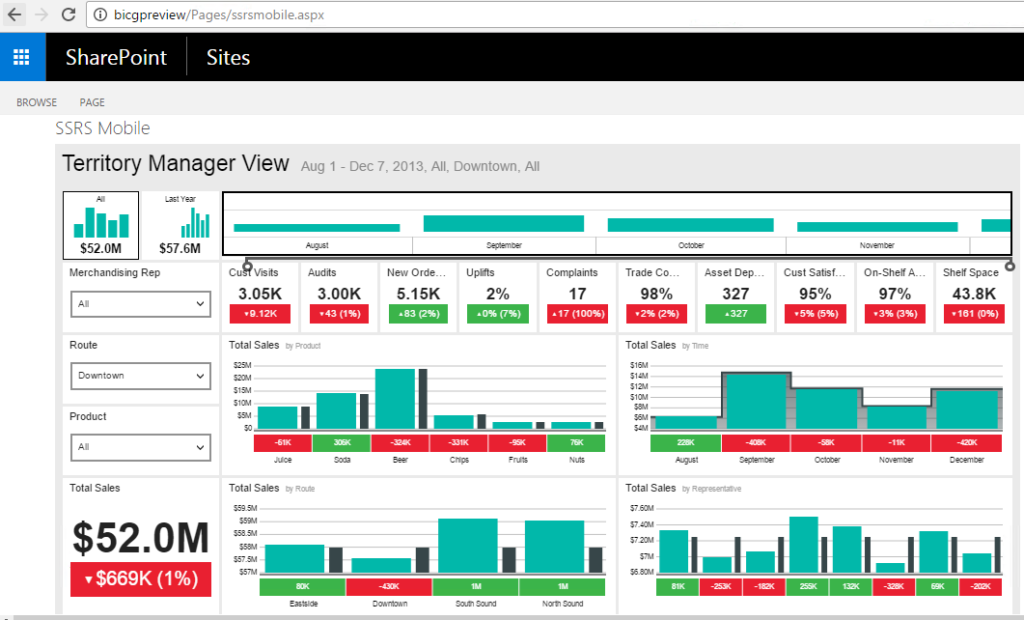
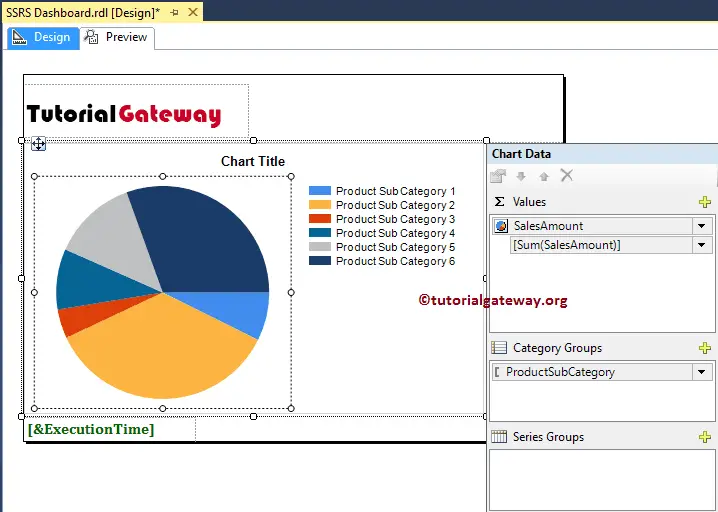
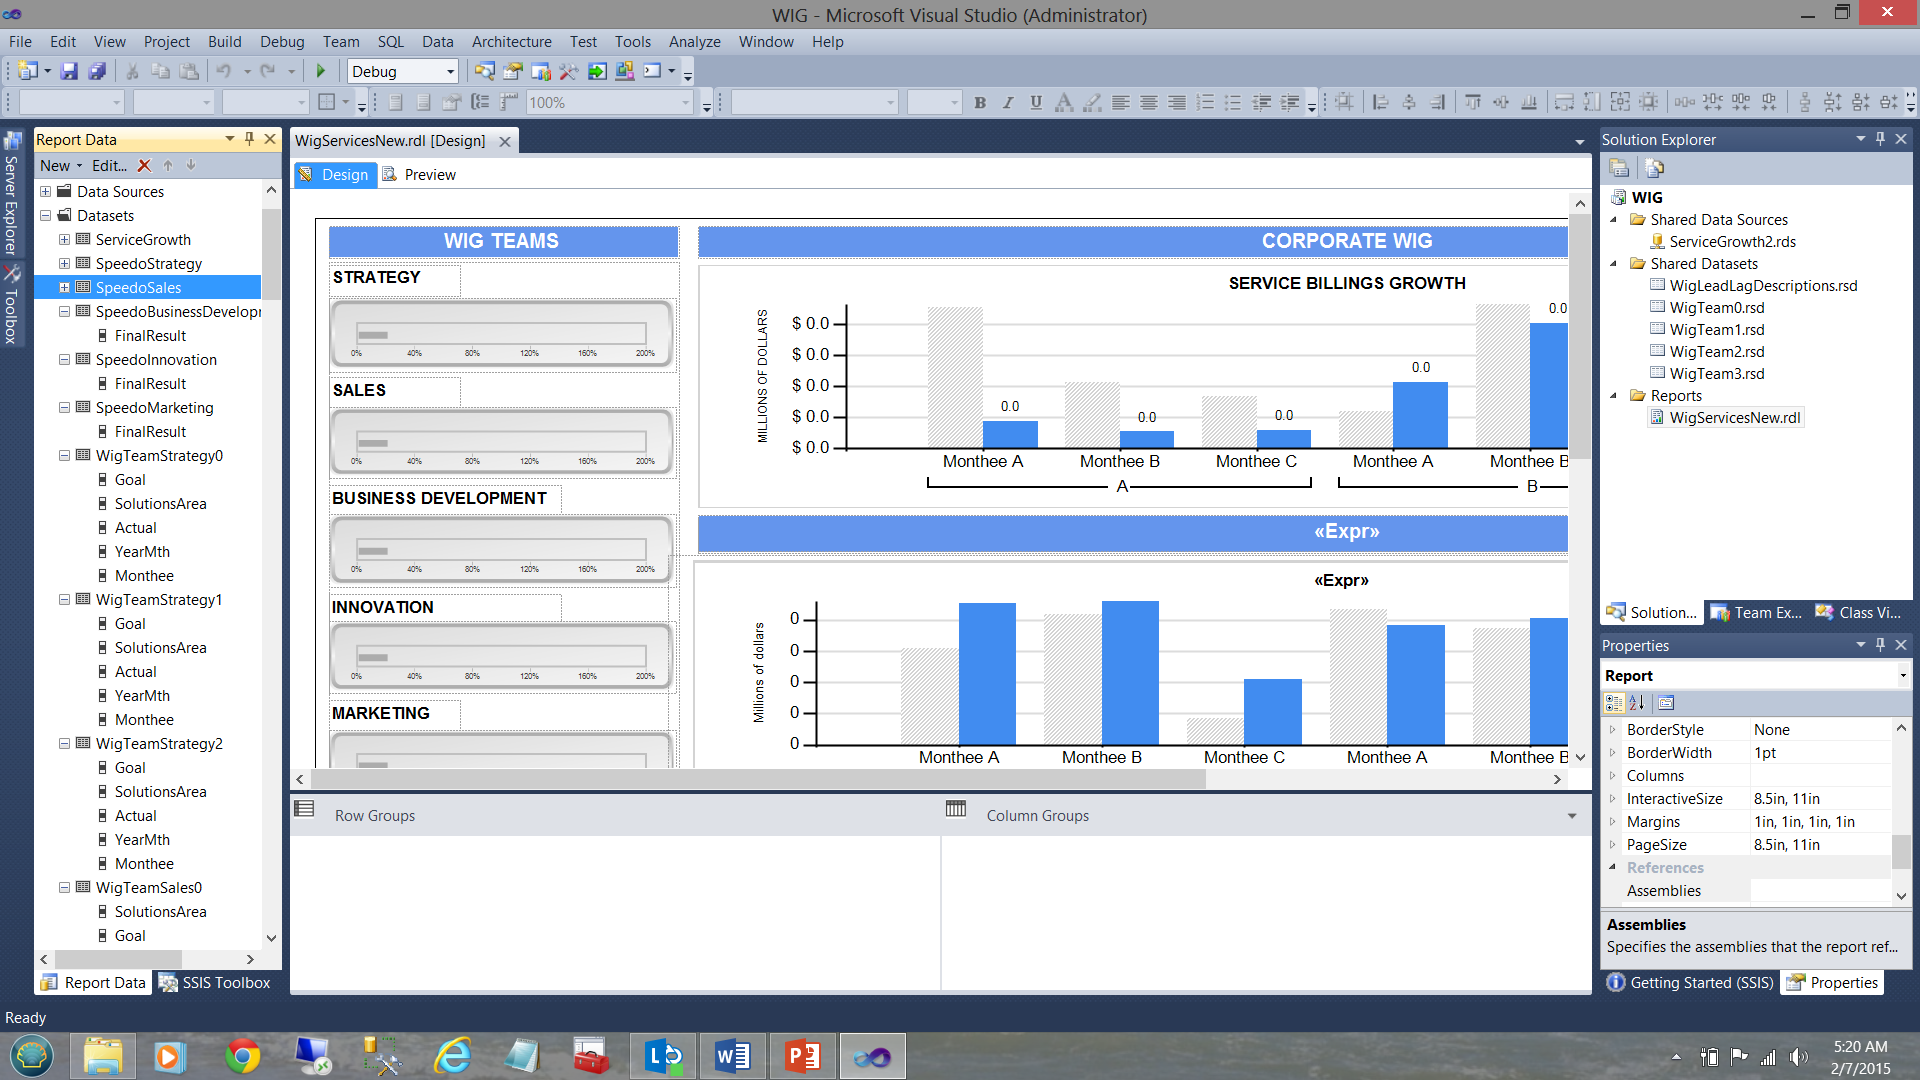
When users are looking to combine a comprehensive set of business health and “speed” gauges (scorecard) and related information in a small space, a dashboard is used to accomplish this goal. A dashboard provides a short, typically one-page, summary view of a business (much like a car’s dashboard summarizes a car’s status) and allows drill down through the items on the top page to retrieve detailed information. SharePoint is an excellent platform to host dashboards and greatly simplifies arranging reports in a meaningful fashion on a page.
Today, when everybody is so short on time, it might be easy to miss an information point that could prove fatal for a business. Exception reporting is what comes to the rescue of a time-constrained user. Unlike regularly scheduled reports or summaries provided by scorecards, exception reports are created and delivered to a user when an unusual event occurs. An exception report removes the “noise” created in periodic reports, focusing instead on mission-critical anomalies. An example of such an anomaly could be a sudden drop in daily sales for a particular region.
Other typical reports include various views of sales (geographic, demographic, product, promotion breakdowns), inventory, customer satisfaction, production, services, and financial information.
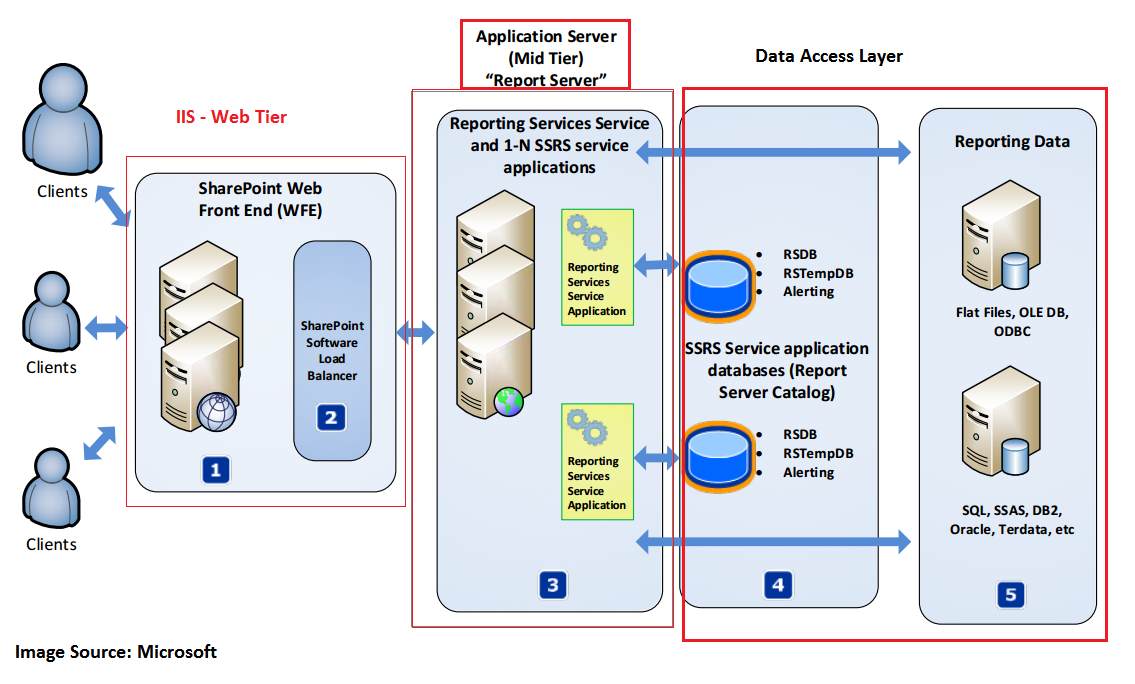
Клиент-серверная система SQL Server
Клиент-серверная система SQL Server может иметь двухзвенную установку (two-tier setup) либо трехзвенную установку (three-tiersetup). Независимо от варианта установки, программное обеспечение и базы данных SQL Server размещаются на центральном компьютере, который называется сервер базы данных (database server). Пользователи работают на отдельных компьютерах, которые называются клиенты (clients). Доступ пользователей к серверу базы данных производится при помощи приложений с их компьютеров-клиентов (в двухзвенных системах) либо при помощи приложений, выполняющихся на специально предназначенном для этой цели компьютере, который называется сервер приложений (application server) (в трехзвенных системах).
В частности, в двухзвенных системах клиенты исполняют приложения, осуществляющие доступ к серверу базы данных непосредственно через сеть.
Таким образом, компьютеры-клиенты исполняют программный код, соответствующий нуждам предприятия, и код, отображающий для пользователя результаты доступа к базе данных. Такие клиенты называются толстыми (thick client), потому что они выполняют два вида работы (cм. рис. 1). Двухзвенная установка полезна при относительно небольшом количестве пользователей, потому что для соединения с каждым из пользователей расходуются системные ресурсы, такие как память и блокировки (locks). Чем больше будет количество соединений с пользователями, тем хуже будет производительность системы, из-за соперничества за ресурсы. В этих условиях вас может заинтересовать применение трехзвенной системы.
Рис. 1. Двухзвенная клиент-серверная система
Как уже говорилось ранее, в трехзвенной установке имеется третий компьютер, который называется сервер приложений. В системах этого типа в задачи компьютеров-клиентов входит лишь исполнение программного кода по вызову функций с сервера приложений и отображение результатов доступа.
Такие клиенты называются тонкими (thin client). Cервер приложений исполняет приложения, которые выполняют задачи, требующиеся для нужд предприятия, эти приложения являются многопотоковыми (multithreaded), благодаря чему с ними могут работать много пользователей одновременно. Cервер приложений соединяется с сервером базы данных, осуществляет доступ к данным и возвращает результаты клиенту (см. рис. 2).
Достоинством трехзвенной системы является то, что можно позволить серверу приложений организовывать все клиентские соединения с сервером базы данных, вместо того, чтобы разрешить каждому клиенту самостоятельно устанавливать соединения (такая самостоятельность может привести к нерациональному использованию ресурсов сервера базы данных). Этот подход называется организация пула соединений (connection pooling), при этом предполагается, что запросы клиентов помещаются в пул (или, говоря точно, в очередь, queue), в котором они будут дожидаться ближайшего доступного соединения. Сразу же по освобождении соединения, оно может использоваться для нужд следующего запроса из очереди.
Организация пулов соединений позволяет в некоторой степени регулировать объем работы, выполняемой сервером базы данных, конфигурируя количество соединений, имеющихся в пуле и, следовательно, количество соединений, доступных для выполнения задач пользователей (количество соединений можно конфигурировать программно). Так можно избавиться от потребности в большом количестве пользовательских соединений, способных быстро израсходовать ресурсы и замедлить скорость работы. Организация пулов соединений может быть реализована при помощи Internet Information Server (продукта фирмы Microsoft) и программного обеспечения для организации пулов соединений, вроде COM+.
Для некоторых корпоративных систем и веб-сайтов требуется большая производительность, чем способен обеспечить один сервер. SQL Server обладает способностью разделять таблицы по нескольким серверам, благодаря чему можно распределить нагрузку по обработке данных.
Рис. 2. Трехзвенная клиент-серверная система
Types of SQL Server Reporting Services (SSRS):
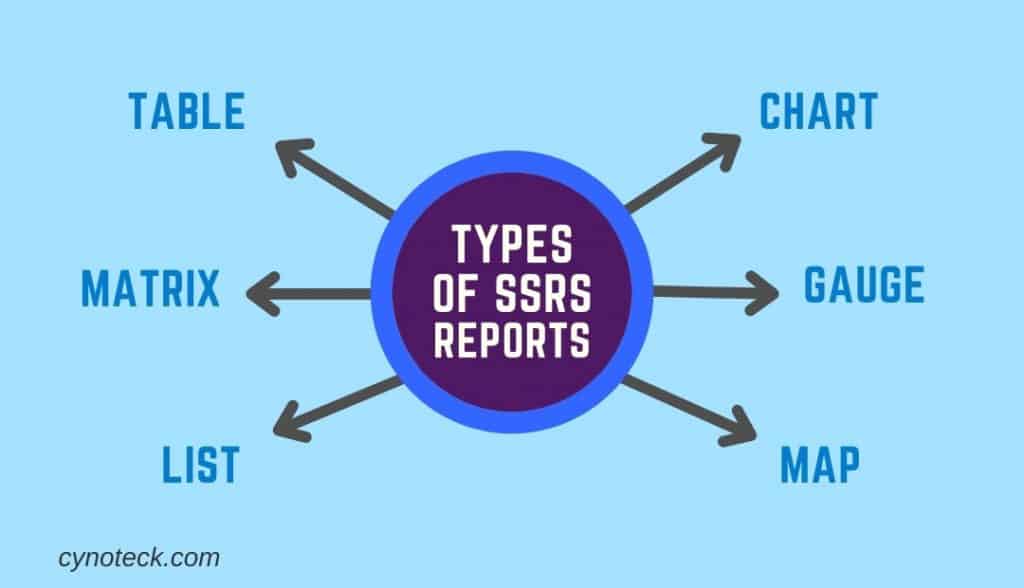
Table – A table is defined as a data region that shows data row by row. It has static columns: when you design your report, you determine the number of columns. The table has dynamic rows: they expand downwards to accommodate the data.
Matrix – A matrix is also called a crosstab. A matrix data region includes both dynamic rows and columns: they expand to adjust the data. A matrix can have static rows and columns, and dynamic rows and columns.
List – A list is a data region that displays data arranged in a freeform style. You can set report items to build a form with text boxes, images, and other data regions positioned anywhere within the list.
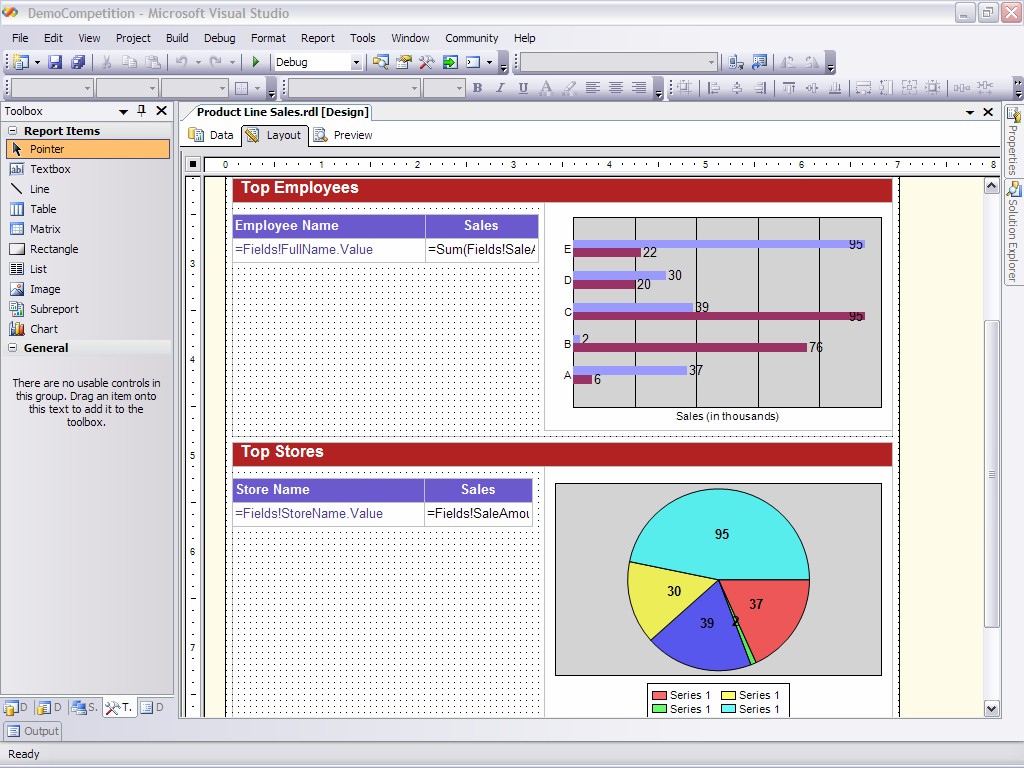
Chart – A chart shows data graphically. Examples of charts incorporate pie, bar, and line charts, but there are many more styles that are supported.
Gauge – A gauge shows data as a range with an indicator indicating a specific value within the range.
Map – A map allows you to present data against a geographical background. Map data can be an ESRI shapefile, spatial data from a SQL Server query, or Microsoft Bing map tiles.
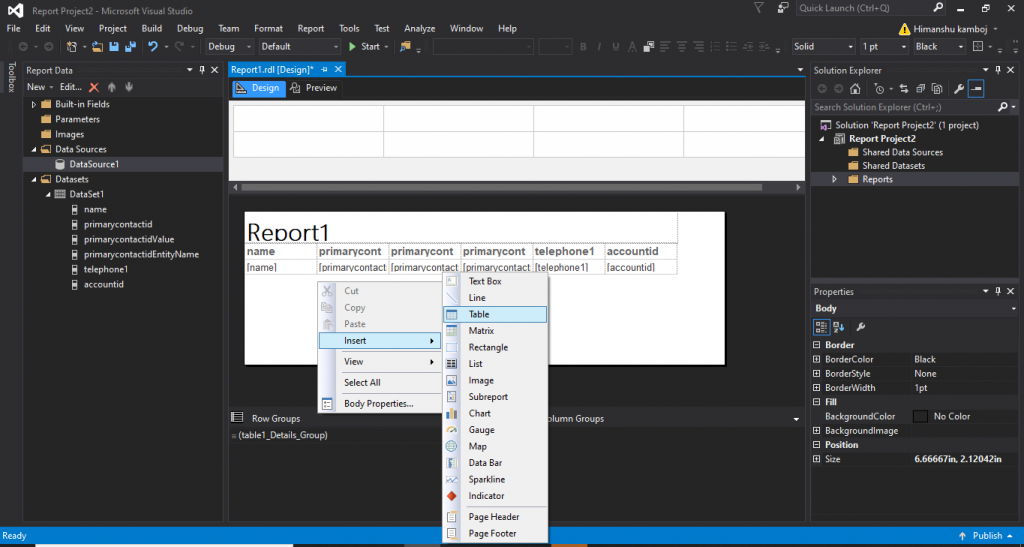
How to Create a Tabular Report Using Fetch XML
- After successfully installation of SSDT tools and authoring extension of CRM dynamics open the visual studio and click to new file-> new project.
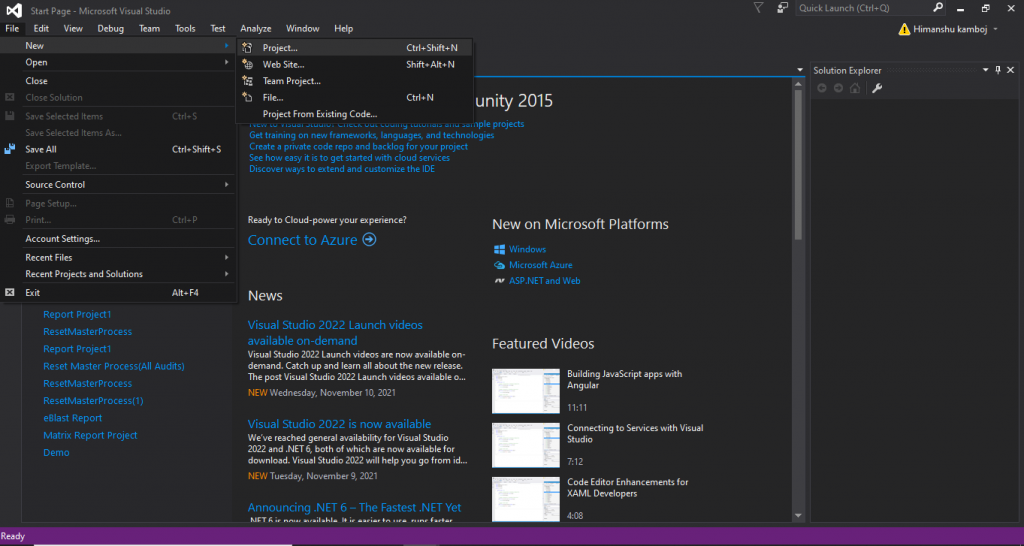
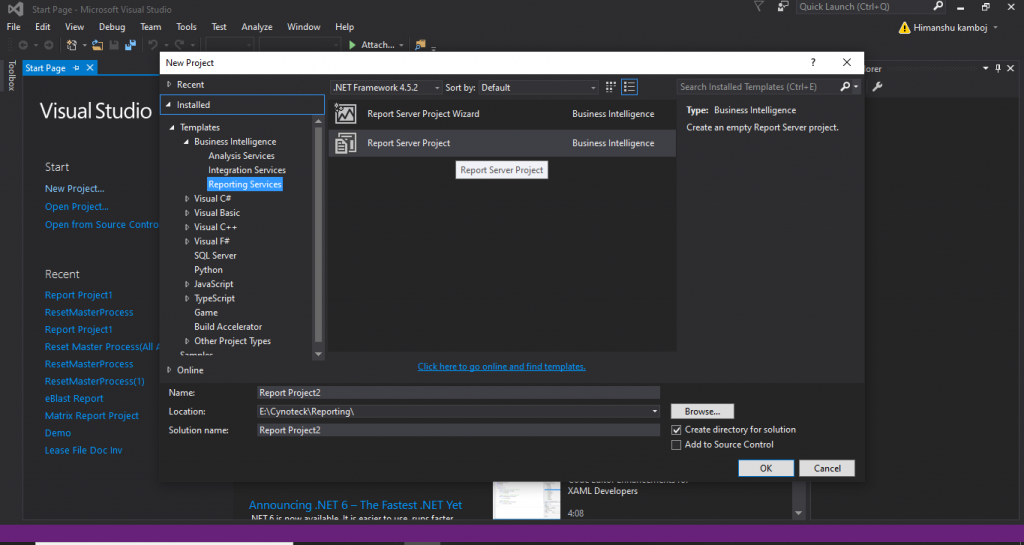
Click on the Reporting services under the Business Intelligence Section and select the Report Server Project Wizard. You can select the location by clicking on the browse option, to which location you want to save the reporting project.
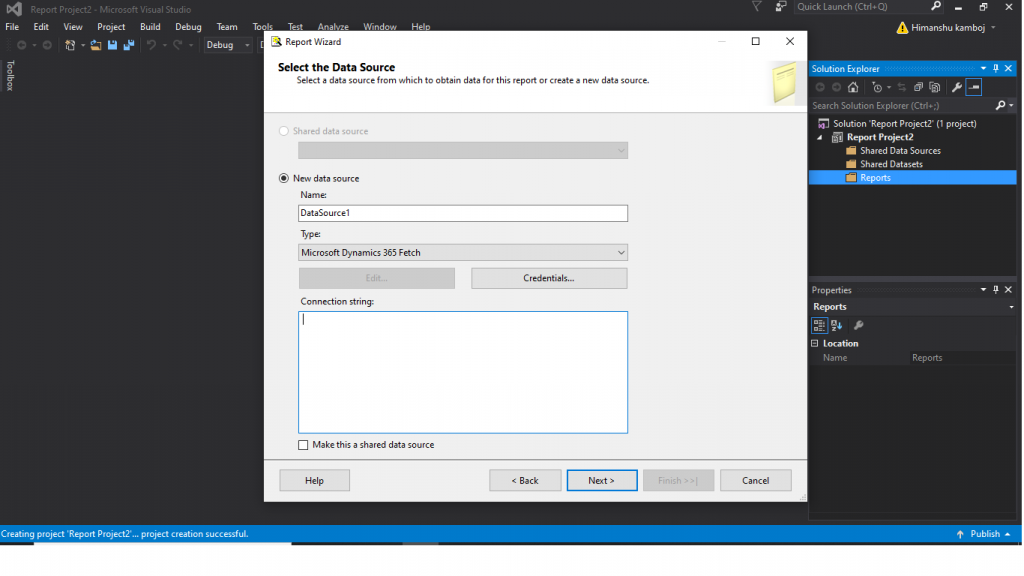
After clicking ok you will see this window below, here you have set the data source properties like connection string and type. In the connection string, you have to put the URL of your organization.
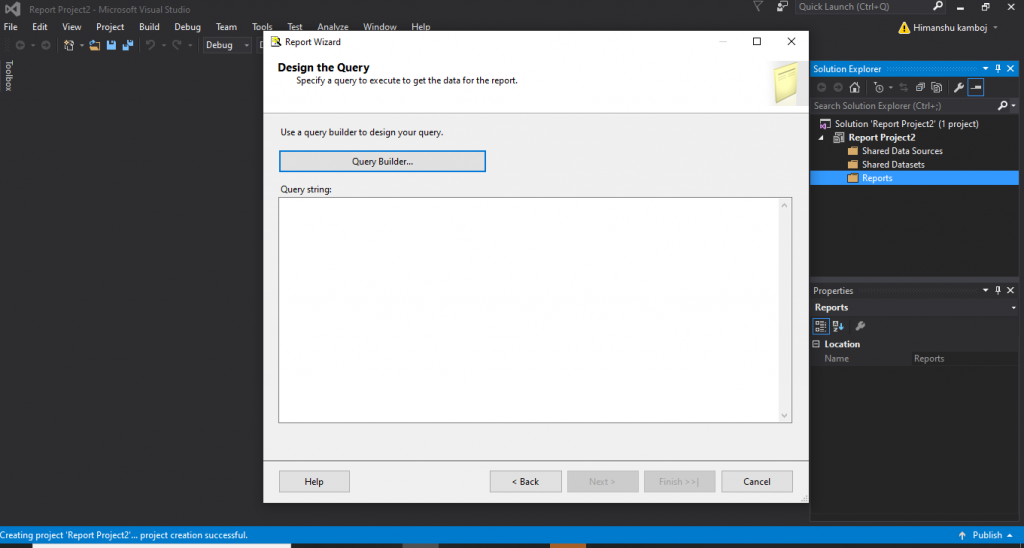
Now you must put your fetch query here in this query string.
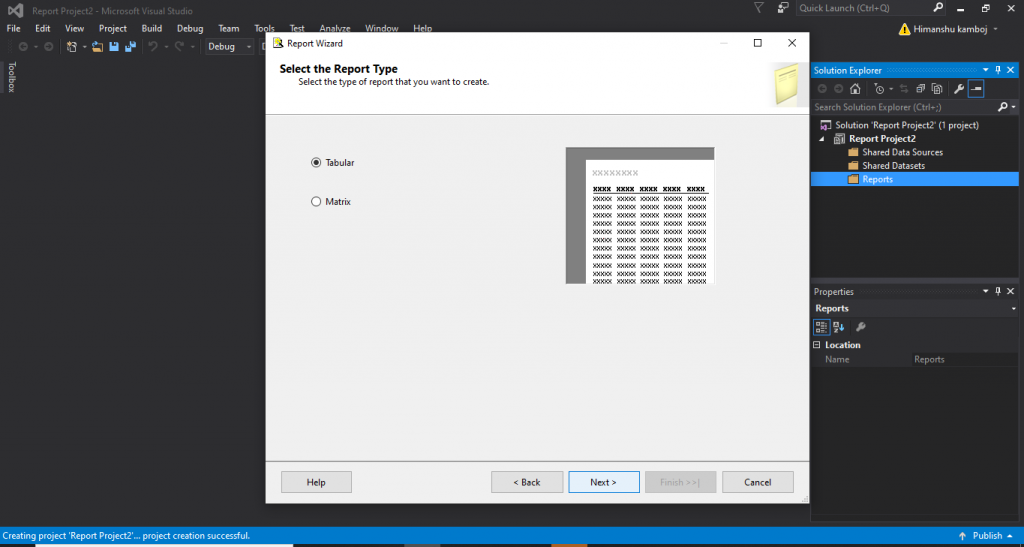
Select the type of report tabular or matrix.
Now report is ready to run, you can preview the report by clicking the preview button.
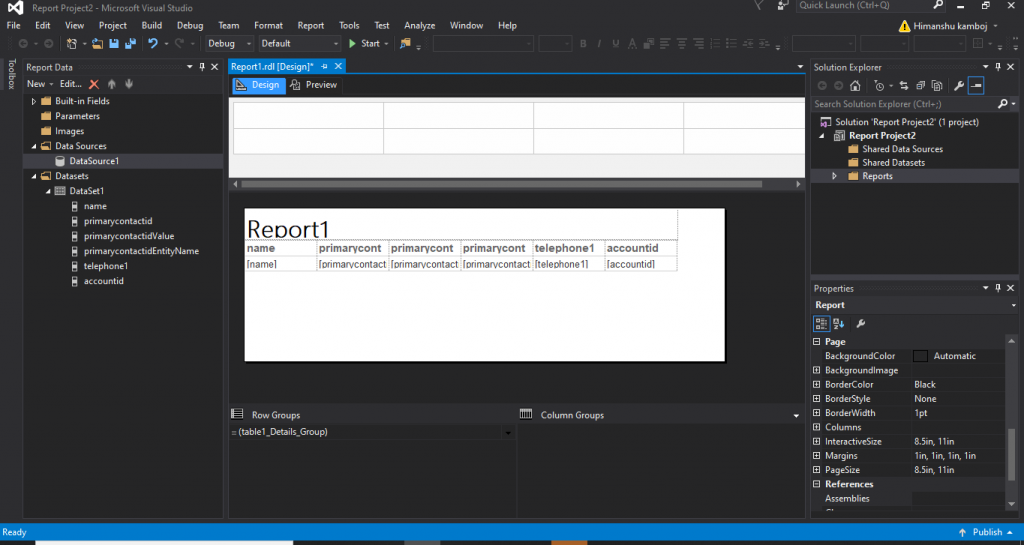
If you want to use more features of the report, then you can right-click on the screen and can insert the items according to you.
What is RDL?
Report Definition Language is shortly known as RDL. It defines all possible aspects of a report using an XML grammar which is validated by an XML schema.


The description of an individual report is based on RDL. It includes instructions for rendering the design of the report at the run time.
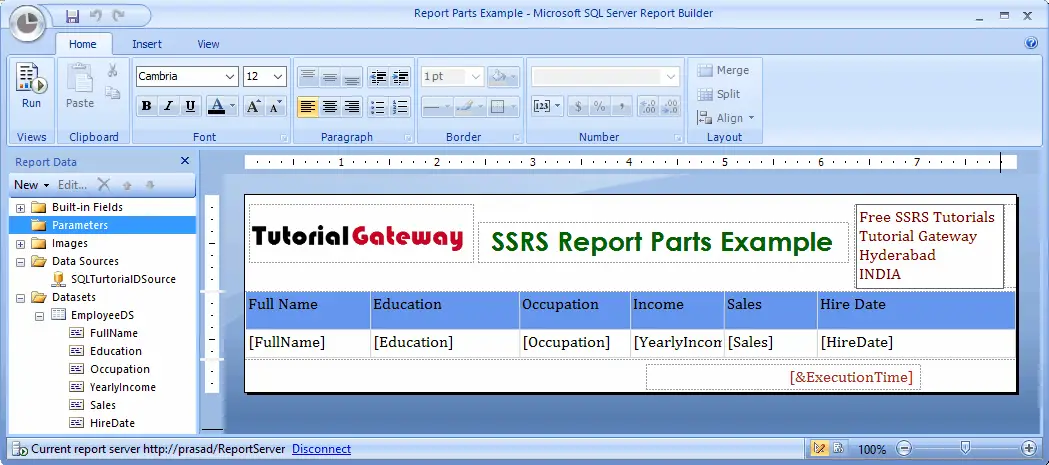
Tabular Reports
Use a table to display detailed data, manage the data in row groups, or both. The Table template includes three columns with a detailed row for data and a table header row.
The following figure illustrates the initial table template, selected on the design surface:

Table template on the design surface, selected.
You can group data by writing your expression, by a single field, or by multiple fields. You can build nested groups or independent, adjacent groups and show aggregated values for grouped data, or add totals to groups. For instance, if your table contains a row group named , you can add a subtotal for each group and a total for the report. To enhance the appearance of the table and highlight the data you want to spotlight, you can combine cells and apply formatting to data and table headings.
You can initially hide detail or group data and incorporate drill-down toggles to allow a user to interactively select how much data to show.
Matrix Reports
Matrix is as simple as a tabular form of SSRS, but it will show the data grouped by rows and columns while in the tabular form data is only grouped by the rows. Some of the data you might expect to see in a row can become a column header. This is like using a pivot table in a spreadsheet.
At run time, the matrix can add the columns and rows according to your fetch XML or SQL query as the report data and data regions are combined, a matrix grows horizontally and vertically on the page.
Why SSRS?
Here, are prime reasons for using SSRS tool:
- SSRS is an enhanced tool compared to Crystal Reports
- Faster processing of reports on both relational and multidimensional data
- Allows better and more accurate Decision-making mechanism for the users
- Allows users to interact with information without involving IT professionals
- It provides a World Wide Web-based connection for deploying reports. Hence, reports can be accessed over the internet
- SSRS allows reports to be exported in different formats. You can deliver SSRS reports using emails
- SSRS provides a host of security features, which helps you to control, who can access which report
Внешние ссылки
- Microsoft SQL Server: домашняя страница служб Reporting Services
- Microsoft SQL Server: страница ресурсов служб Reporting Services
- SSRS с Visual Basic и Visual C #
- SSRS в вашем приложении ASP.Net
- Библиотека PHP для подключения к SSRS через SOAP
- Доннер, Кристиан; Папас, Илья (10 января 2005 г.). «Прокси-сервер Java для служб отчетов MS SQL Server» . JavaWorld . Проверено 21 июля 2020 .
- Информационный документ по индивидуальному решению SSRS I от MindHARBOR
- Разработка корпоративных приложений Microsoft SQL Azure , ISBN 978-1-849680806 , Джаярам Кришнасвами, 2010 г.
- Изучите SQL Server Reporting Services 2008, ISBN 978-1-847196187 , Джаярам Кришнасвами, 2008 г.
- Изучение служб отчетов SQL Server 2012, ISBN 978-1-849689922 , Джаярам Кришнасвами, 2013 г.
- Проверка подлинности Windows в службах отчетов SQL Server
Benefits of Reporting in SSRS
There are seven main benefits of SSRS for reporting:
-
Easy access to report formats: The reports can be accessed easily from within Microsoft Dynamics GP. There is also a one click access from the user’s personalized ‘My Reports’ list of frequently used formats. In terms of generating the report, SSRS supports a variety of formats including PDF or Excel. Additional formats can be used via plugins or an external tool such as PBRS.
-
Drill down action: The user can quickly access essential information with the ability to drill down within the reports.
-
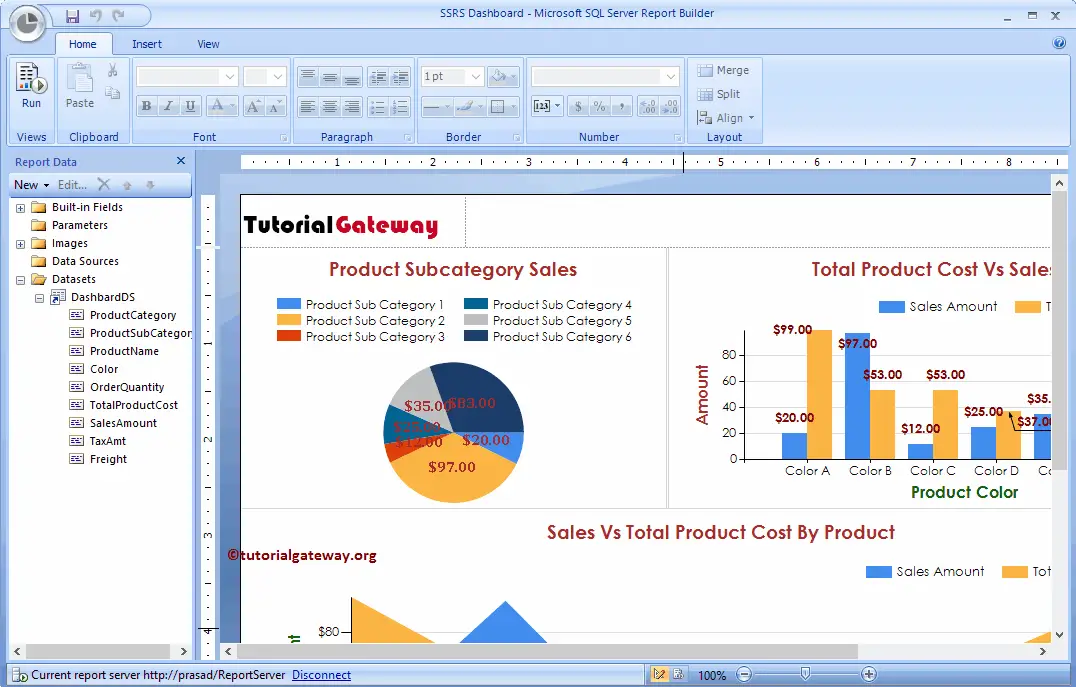
Chart options: SQL reporting services offer various report layout options including pie chart, line chart and bar chart capabilities. These can be used to highlight key information and enhance business presentations.
-
Customized Filtering: With SQL server reporting services the users can filter report data using dynamic parameters.
-
Flexible report views: SQL reporting services allow for a collapsible report view to expand sections, reducing complex reports to manageable proportions.
-
Sub-reports: Users can create sub reports with a main report and also the main report to one or more sub reports through a set of parameters.
-
Table View: This report layout option quickly presents the data in a table format for better viewing and report distribution across different units of a business.
Обзор Microsoft SQL SERVER 2012
C выходом SQL Server 2012 (ранее «Denali») разработчики располагают более удобными средствами создания приложений для работы с базами данных. Обновления, с одной стороны, позволили расширить круг решаемых задач, а с другой, добиться более производительной работы существующих решений. Администраторы баз данных смогут без особых усилий достичь требуемой надежности и безопасности информации. Кроме того, возросла степень защищенности хранимых на сервере данных. Бизнес-аналитики смогли оценить возможности нового аналитического механизма, который был предложен специалистами MS еще в SQL Server 2008 R2 в виде PowerPivot на стороне клиента (в Excel 2010) и на серверной стороне SharePoint 2010.
SQL Server 2017 Reporting Services
Download :::image type=»icon» source=»../includes/media/download.svg» border=»false»:::
To download SQL Server 2017 Reporting Services, go to the .
Comments on reports
Comments are now available for reports, to add perspective, and collaborate with others. You can also include attachments with comments.
Query designer support for DAX now in Report Builder and SQL Server Data Tools
In Report Builder and SQL Server Data Tools, you can now create native DAX queries against supported SQL Server Analysis Services tabular data models. You can use the query designer in both tools to drag and drop the fields you want. The DAX query is then generated for you.
Read more on the Reporting Services blog.
- Download SQL Server Data Tools — Release Candidate.
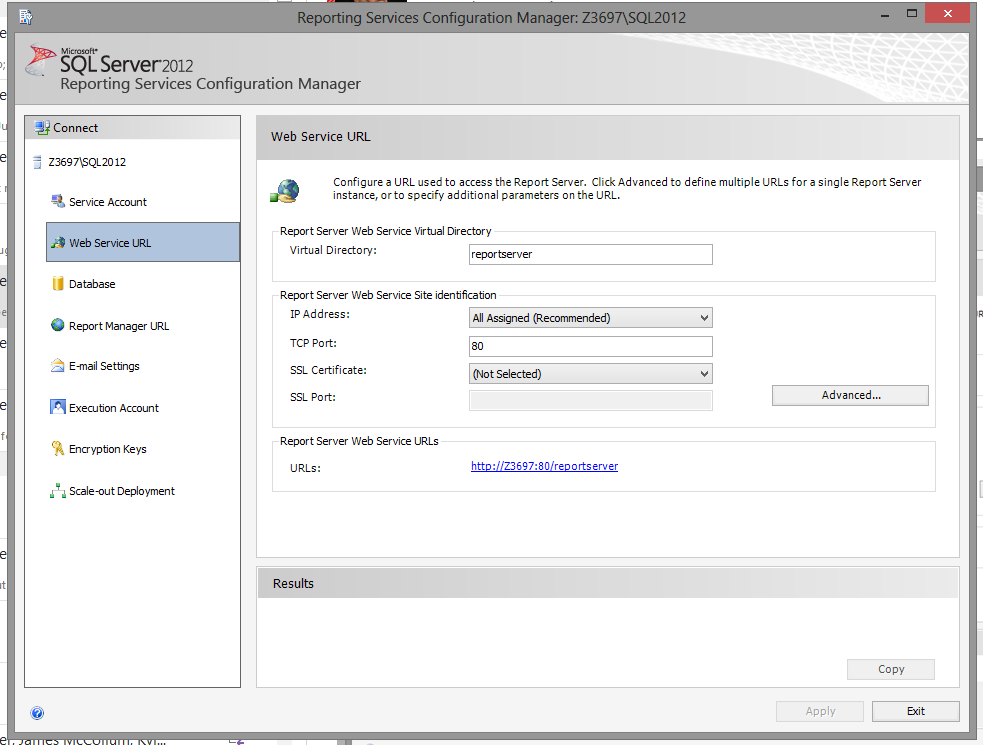
SSRS Configuration
General Settings
Once the SSRS feature is installed successfully, open Reporting Service Configuration Manager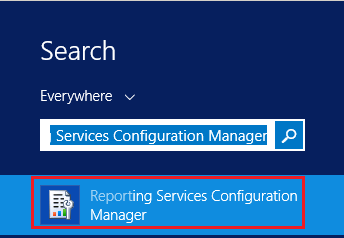
Connect to the Report Server Instance.
Review Report Server Status and make sure it’s started.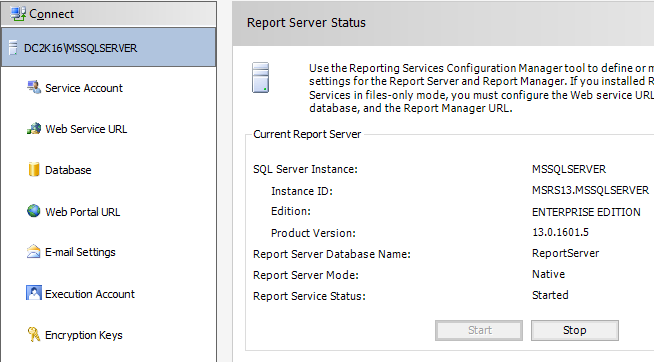
In «Service Account», you will find the report server service account that runs the Report Server Service.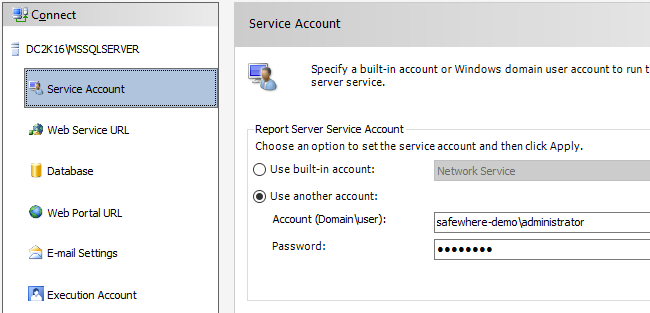
Go first to the «Database» section to configure the database that holds the all report server content and application data. Click “Change Database” to create the report server database for the first time.
Check “Create a new report server database” then click “Next”
Make sure the database server is correct.
Set the authentication type as (Integrated User or SQL Server account). Note: this account must have permission to connect to the database server.
Provide the correct account credentials.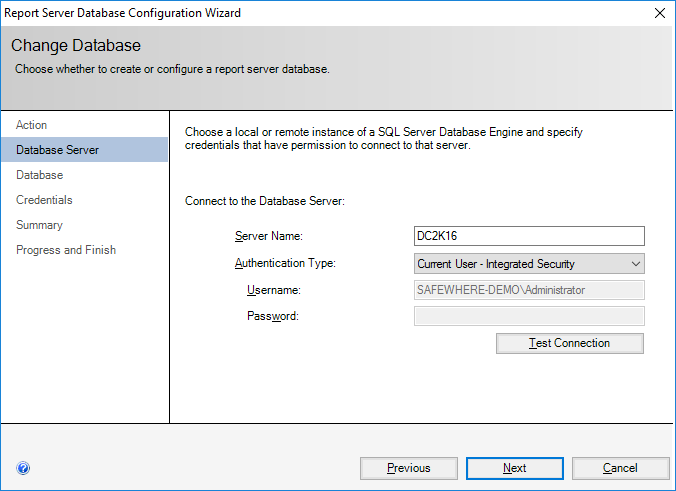
Test and make sure that the connection is established successfully.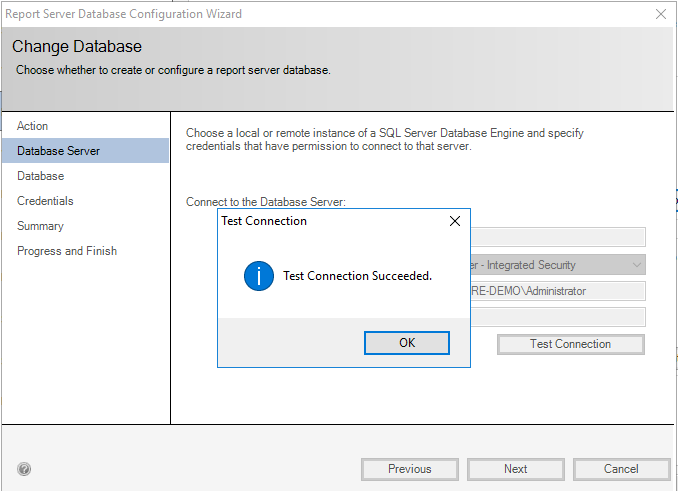
Specify the “Database Name” as you prefer.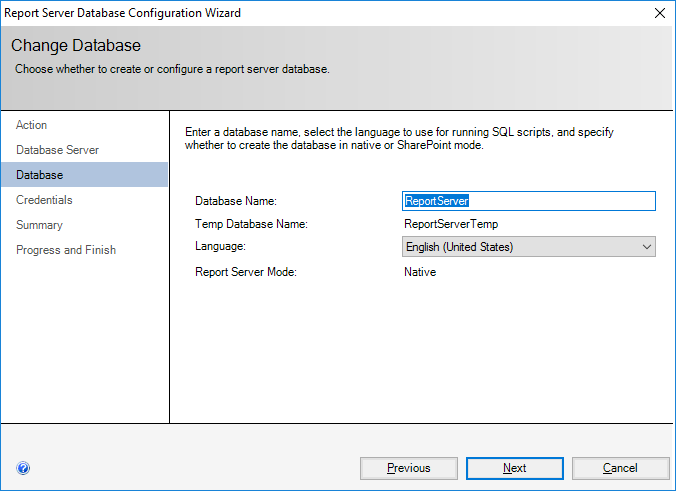
Specify the credentials of an existing account that the report server will use to connect to the report server database.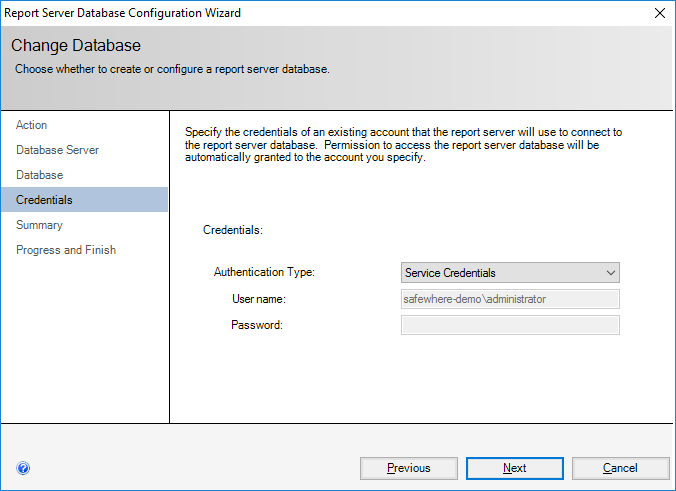
Review the summary information, and make sure that everything is set properly before proceeding.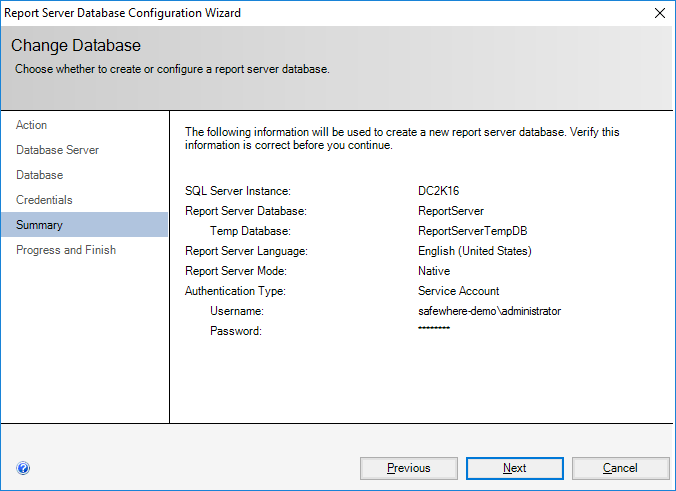
Wait while the report server database wizard configures the database then click “Finish”.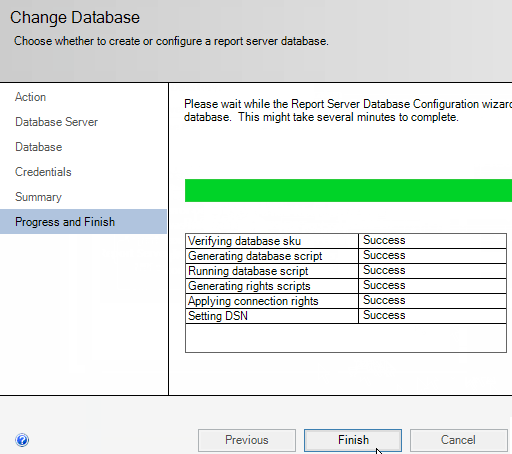
Go back to configure the «Web Service URL».
- Set the “Report Server Web Service Virtual Directory”.
- Set the “Report Server Web Service Site identification” based on your requirements then click «Apply».
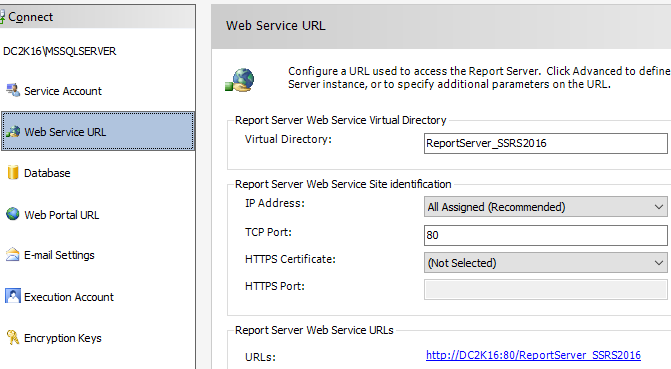
Test the Report Server Web Service URL that should be now browsed properly.
Go now to the «Report Manager URL», specify the virtual directory as you prefer then click Apply to configure it.
Once the Report Manager Completed Successfully, Click the Report Manager URL to test and ensure it should be now browsed properly.
Go to the «Encryption keys» to take a backup of the symmetric key that used to encrypt sensitive data in the report server database like connection strings, credentials …etc. it will be helpful in case you migrate or move the report server installation to another server, you can restore this key to regain access to the encrypted content.
E-mail Settings for subscription
- Sender Address: fill in the sender’s email address
- SMTP Server: fill in the name or IP Address of the SMTP server used to send reports
- Email credential: fill in the Username, Password and Confirm Password.
- Use secure connection: check this if the SMTP server requires SSL encryption
Note: it is recommended that outbound rules should be added in Windows Firewalls to allow using SMTP port (default 25 for non secure and 587 for secure connections — ask system administrator if you do not know what ports are using)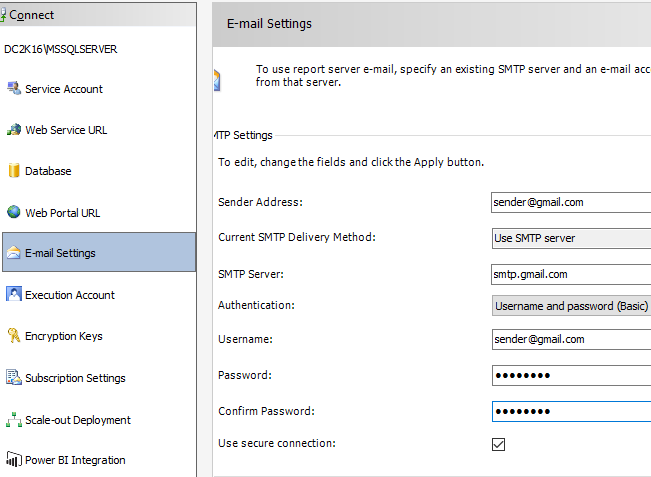
How to format your Report
Format currency and date
If you want to format Date field to show only the date, follow the steps below:
- In the Design tab, right-click the desired cell, then click Text Box Properties.
- Find and click Number, then in the field Category click Date
-
As Type select date format you want, and click OK to finish.
If in your table you have a field that holds information about currency, but you only see ordinary numbers, you can format that field to display a number as currency:
- In the Design tab, right-click the desired cell, then click Text Box Properties.
- Find and click Number, then in the field Category click Currency
- In accordance to your need you can change defaults
-
Click OK to finish.
Changing column width and text style
Text style you can change by clicking the Format menu. In Format menu find Font, then click whatever you need (bold, italic, etc.)
Разница между Power BI и SSRS
SSRS и power bi являются программным обеспечением для создания отчетов, но между этими двумя есть некоторые существенные различия: в SSRS отчеты содержат больше ручных вмешательств и много ручных действий, которые отнимают время и делают его беспокойным для пользователя, но в power bi одни и те же функции доступны одним нажатием кнопки.
Power BI — это инструмент визуализации данных SaaS и аналитический инструмент для анализа данных и получения информации о данных, который имеет очень удобные функции и инструменты, тогда как SSRS, что означает «SQL Server Reporting Services», представляет собой полностью серверную систему отчетов. инструмент, который помогает нам предоставлять данные и создавать подробный отчет из данных. В этой статье мы подробно рассмотрим ключевые различия между Power BI и SSRS.


Ключевые отличия
Ключевые различия между службами отчетов Power BI и SQL-сервера заключаются в следующем:
# 1 — Удобство для пользователя
Это одна из ключевых областей, на которую стоит обратить внимание. Power BI — такой удобный инструмент, с помощью которого можно просто перетаскивать поля, чтобы создавать отчеты и аналитические данные
SSRS не так прост в использовании, потому что вам нужно иметь навыки кодирования, чтобы по-настоящему поиграть с отчетами в SSRS.
# 2 — Обработка данных
В бесплатной версии Power BI для рабочего стола мы можем обрабатывать до 1 ГБ данных на пользователя, а в платной версии — до 10 ГБ. Если данные выходят за рамки этого, нам нужно получить данные из облачных инструментов, таких как AZURE.
Но службы отчетов SQL-сервера. может без проблем обрабатывать большой объем данных, но вы должны помнить, что стоимость этого инструмента зависит от организационной структуры.
Сравнительная таблица
| Предметы | Power BI | SSRS |
|---|---|---|
| Стоимость приобретения | Power BI — это бесплатная версия для программного обеспечения для настольных ПК, а для услуг Pro и Premium нам нужно заплатить, чтобы приобрести. | SSRS — полностью платное устройство. |
| История | Power BI — недавний продукт Microsoft, выпущенный в 2013 году. | SSRS — гораздо более старый продукт, поэтому он доступен с 2004 года. |
| Клиентская база | Power BI — это инструмент SaaS, поэтому заказчик может загрузить бесплатную версию Desktop и сразу приступить к работе, что обеспечит большую клиентскую базу. | SSRS не самый популярный, как Power BI, поэтому клиентская база недостаточно сильна. |
| Потребность часа | Не многие современные пользователи полагаются на серверный инструмент визуализации, поэтому Power BI — это то, что нужно часу для создания панелей мониторинга. | SSRS — это серверный инструмент, поэтому для его работы требуются хорошо подготовленные программисты. |
| Лицензирование | Лицензирование Power BI требуется только для служб Pro и Premium. | Для получения лицензии на несколько выпусков SSRS требуется определенная стоимость. |
| Обновления в реальном времени | Power BI ежемесячно получает последние обновления в новом выпуске Microsoft. | SSRS обновляется каждые несколько лет. |
| Тип данных | Power BI может обрабатывать любые типы данных. | SSRS может обрабатывать только структурированные и полуструктурированные типы данных. |
| Источники данных | Power BI может получать данные из любого места, что недоступно с помощью серверного инструмента SSRS. | SSRS может получать данные только из SQL Server, хранилища данных SQL и служб SQL Server Analysis Services. |
| Вид использования | Power BI могут использовать те люди, которые хотят публиковать отчеты как в облаке, так и на сервере. | SSRS может создавать только серверные отчеты. |
| Удобство | Power BI можно использовать через настольные, серверные, веб-приложения и мобильные приложения. | Доступ к SSRS можно получить только в Интернете и в рабочей области. |
| Инструмент Технологии | Power BI — это современный технологический инструмент, исходный код HTML 5 и облачный SaaS. | SSRS — это старый технологический инструмент, основанный на инструменте корпоративной визуализации. |
| Удобный для пользователя характер | Power BI можно использовать в качестве инструмента перетаскивания для создания визуализаций благодаря богатым графическим инструментам визуализации. | SSRS не так богата графикой и визуальными эффектами, но имеет очень хорошую функцию детализации. |
| Реализация | Внедрение Power BI намного проще по сравнению с SSRS. | Реализация SSRS сложна и требует выполнения множества сложных процедур. |
Выбор очень прост: если вы не программист или не имеете технического образования, очень сложно усвоить язык кодирования SSRS, поэтому лучше выбрать Power BI благодаря простым параметрам перетаскивания. Power BI может предоставлять богатую графику и визуализацию, поэтому, если вы не программист, вам всегда остается Power BI.
Advantages of using SSRS
- It is faster and cheaper.
- Efficient reporting access to information that is residing in both MS SQL Server database or Oracle
- No need for expensive specialist skills
- In SSRS the default report designer is integrated with Visual Studio .NET. This allows us to create an application and reports in the same environment.
- The security is managed in a role-based method which can be applied to folders and reports.
- Subscription-based reports are automatically sent to the users.
- Faster production of reports on both relational and cube data
- Real time information to the business, providing better decision support
SSRS Development Tools
Early versions of SQL Server used Business Intelligence Development Studio (BIDS) as the SSRS development tool. However, starting with SQL Server 2012, you will use SQL Server Data Tools – Business Intelligence (SSDT-BI), which may or may not be on the SQL Server media, depending on the version. Each tool runs as an add-in for Visual Studio. If you do not have Visual Studio in place, the BIDS or SSDT-BI installation will install a Visual Studio shell.
Naming confusion?
Just to add a little confusion, there is also an add-in called SQL Server Data Tools for Visual Studio 2012. This is for database projects, not the BI tools that will allow you to create SSRS projects. It is not the option you want for SSRS development. You will also often see SSDT-BI abbreviated simply as SSDT.
The following table should help you navigate the options, understand the differences, and find the correct process for installing the development tool for your version of SQL Server.
|
SQL Server Version |
Development Tool |
Location of Media |
Documentation |
|
2008 R2 |
BIDS |
SQL Server installation media |
|
|
2012 option 1 |
SSDT-BI and VS 2010 |
SQL Server Installation media |
|
|
2012 option 2 |
SSDT-BI and VS2012 |
Download here http://www.microsoft.com/en-us/download/details.aspx?id=36843 |
|
|
2014 |
SSDT-BI and VS2012 |
Download here http://www.microsoft.com/en-us/download/details.aspx?id=36843 |
Install SCCM Reporting Services Point Role | ConfigMgr
Follow the below steps to install a new reporting services point role using SCCM console:
- Launch the SCCM console.
- Click Administration > Site Configuration. Right click Servers and Site System Roles.
- Right-click SQL Server on which you plan to install reporting services point role and select Add Site System Roles.
Install SCCM Reporting Services Point Role | ConfigMgr
On the General window of Add Site System Roles wizard, you have two options for specifying the site system installation account.
- Use the site servers computer account to install this site system: Select this option to install the site system if both the site server and site system servers are in the same domain. Furthermore, the site server account should be added to the local administrators group on the remote site system server.
- Use another account for installing this site system: Use this option if the site server and site system servers are in a different domain and there is no two-way trust.
Typically, the first option is preferred in most cases while deploying the reporting services point role in an organization. Verify the Active Directory Forest and Active Directory Domain names and click Next.
Install SCCM Reporting Services Point Role | ConfigMgr
If your organization uses Internet Proxy server, specify it on the Proxy page otherwise click Next.
How to Install SCCM Reporting Services Point | ConfigMgr SSRS 30
On the System Role Selection page, from the list of roles, select Reporting Services Point and click Next.
Select Reporting Services Point Role
On the Reporting Services point page, you configure the settings for Reporting Services. This step is critical because the majority of errors such as reporting services server instance blank, is observed here.

If you have installed and configured the reporting services correctly and if the report server database is successfully created, this step should be easy for you. Ideally, the Reporting Services server instance should be automatically populated to SSRS. If the reporting services server instance is blank, you might need to verify the account permissions and perform additional troubleshooting steps.
In the below example, we see the Site Database server name, Database name, Folder Name, and Reporting services server instance are automatically populated.
Specify the credentials that SQL Reporting Services will use when connecting to the Configuration Manager site database and click on Verify. The pop-up window “Successfully Verified” confirms the reporting services point account permissions are correct. Click Next.
ConfigMgr SSRS Reporting Services Point Settings
Review the reporting services point role configuration on Summary page and click Next. On the Completion window, click Close. This completes the reporting services point sccm installation steps.
Install ConfigMgr SSRS Reporting Services Point
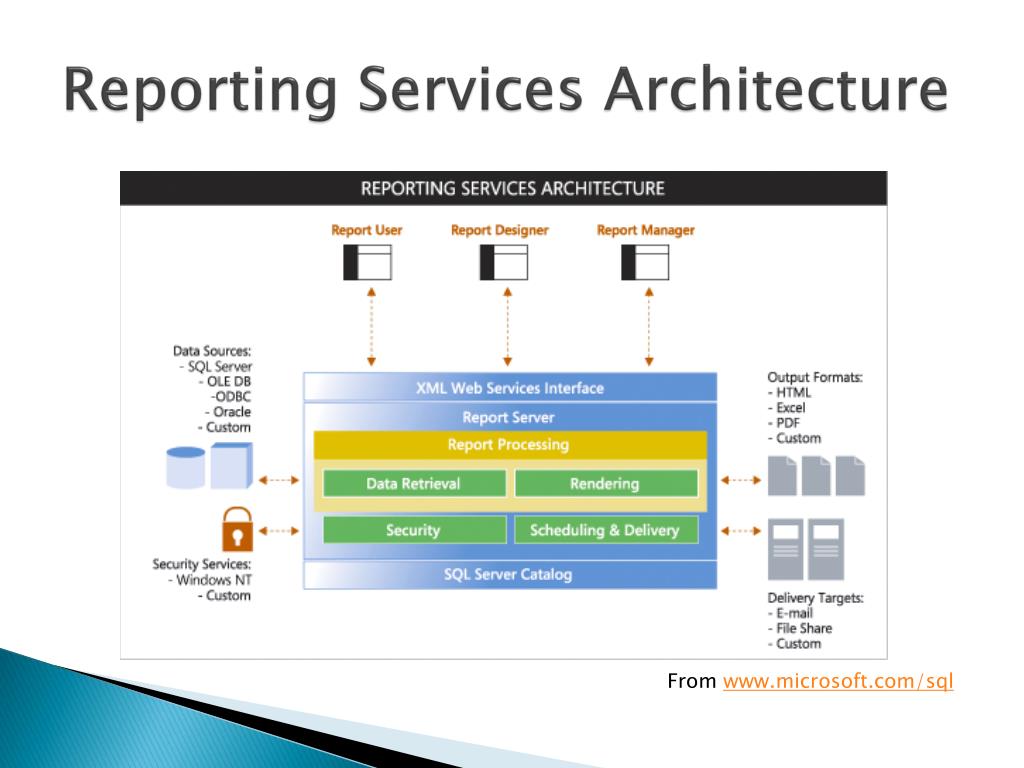
Использовать
Инструменты данных SQL Server для бизнес-аналитики (SSDT BI) сокращают компонент RDL (язык определения отчетов) до графических значков в графическом интерфейсе пользователя (графический интерфейс пользователя). Таким образом, вместо написания кода пользователь может перетаскивать графические значки в формат отчета SSRS для большинства аспектов отчета SSRS.
Отчеты, определенные RDL, можно загружать в различных форматах. включая Excel, PDF, CSV, XML, TIFF (и другие форматы изображений) и веб-архив HTML. SQL Server 2008 и 2012 SSRS также могут создавать отчеты в Microsoft Word (DOC), а сторонние генераторы отчетов предлагают дополнительные форматы вывода.
Пользователи могут напрямую взаимодействовать с веб-службой сервера отчетов или вместо этого использовать диспетчер отчетов, веб-приложение, которое взаимодействует с веб-службой сервера отчетов. С помощью диспетчера отчетов пользователи могут просматривать отчеты, подписываться на них и управлять ими, а также управлять и поддерживать источники данных и параметры безопасности. Диспетчер отчетов также может доставлять отчеты SQL по электронной почте или размещать их в общей папке.
Безопасность является ролевой и может быть назначен отдельному элементу, например отчету или источнику данных, папке элементов или всему сайту. Роли безопасности и права наследуются и могут быть перегружены.
Обычно отчеты открываются только тем пользователям, которые могут их запускать, а соединения SQL в источнике позволяют запускать кого угодно с достаточными привилегиями, потому что настройка проверки подлинности Windows через выполнение отчетов трудоемка и требует много времени: запись имени участника-сервера ( требуется доступ АДМИНИСТРАТОРА ДОМЕНА) создается в Active Directory, связывая службу отчетов Sql Server с пользователем, под которым служба работает на сервере (сетевой пользователь для облегчения запросов в Active Directory) … и пользователь учетной записи службы должен иметь делегирование опция включена, сервер также должен быть доверенным для делегирования; пользователи Windows, желающие запускать отчеты, должны быть настроены на разрешение делегирования — поэтому будут использоваться протоколы проверки подлинности Kerberos. Сама служба отчетов должна отредактировать конфигурацию, чтобы включить протоколы Kerberos … но тогда отчеты будут безопасными и будут отображать только данные, разрешенные отдельным пользователям (на основе конфигурации безопасности SQL).
Отчеты RDL можно просматривать с помощью автономного сервера отчетов, который поставляется с Microsoft SQL Server, или используя ASP.NET Веб-элемент управления ReportViewer или с помощью ReportViewer Windows Forms контроль. Последний метод позволяет встраивать отчеты непосредственно в веб-страницы или Приложения .NET для Windows. Элемент управления ReportViewer будет обрабатывать отчеты путем: (а) обработки на сервере, когда отчет создается сервером отчетов; или (b) локальная обработка, когда элемент управления отображает сам файл RDL.
Службы отчетов SQL Server также поддерживают для этого случая отчеты: дизайнер разрабатывает схему отчета и развертывает ее на сервере отчетов, где пользователь может выбирать соответствующие поля / данные и создавать отчеты. Затем пользователи могут загружать отчеты локально.
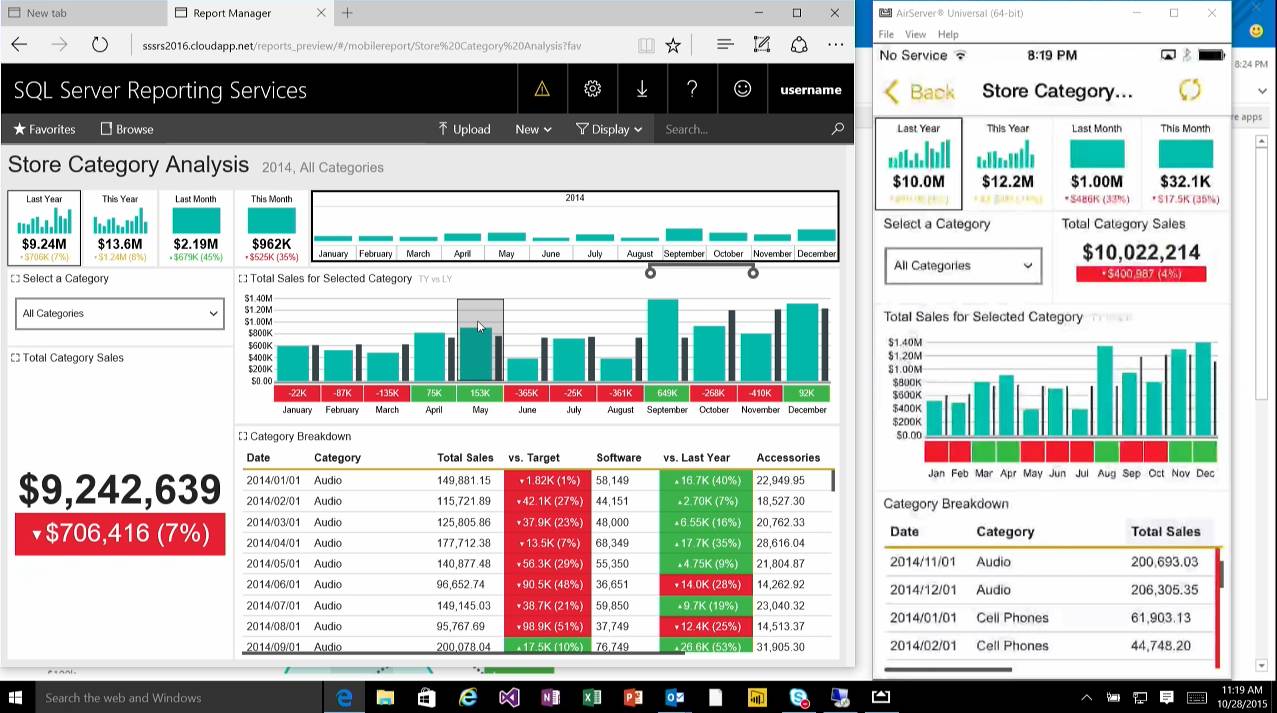
Microsoft SQL Server 2012 SP1 расширяет поддержку Microsoft для просмотра отчетов на мобильных платформах, включая Microsoft Surface, Apple iOS 6 и Windows Phone 8.